SEMi-Complete by Design
A Monte Carlo Simulation to Assess Measurement Invariance in Moderated Nonlinear Factor Analysis and SEM Trees
Why Care About Measurement Invariance?
Measurement invariance (MI) is a prerequisite for meaningful comparisons of latent constructs across groups (Cheung and Rensvold 2000; Meredith 1964).
Violations of MI imply that observed group differences may reflect measurement artifacts rather than substantive differences in the underlying constructs (Putnick and Bornstein 2016).
Without MI, conclusions about group differences in means, variances, or relations are not statistically justified (Putnick and Bornstein 2016).
Why Care About Measurement Invariance?
In empirical practice, MI is often assumed rather than systematically evaluated.
Common practice
- Measurement invariance is often implicitly assumed rather than empirically tested.
- The majority of psychological studies do not test for MI (Maassen et al. 2025; Rohrer and Paulewicz 2025).
Reporting quality
- When MI is tested, reporting standards are often insufficient for replication (Putnick and Bornstein 2016; Maassen et al. 2025).
- Fewer than 5% of comparison studies reported MI in a recent review (Rohrer and Paulewicz 2025).
Recent re-analyses indicate that only 26% of tested models achieved scalar invariance, while MI failed completely in 58% of cases; in roughly 50% of configural failures, the underlying factor structure differed between groups (Maassen et al. 2025).
The validity of many reported group comparisons therefore remains unclear.
MNLFA (Moderated Nonlinear Factor Analysis)
Moderated Nonlinear Factor Analysis (MNLFA) extends traditional factor models by allowing measurement and latent-variable parameters to vary continuously as functions of observed covariates (Kolbe et al. 2024; Curran et al. 2014).
In this framework, measurement invariance is conceptualized as the moderation of model parameters by an external variable.
Parameters that may vary
- Item parameters: loadings, intercepts
- Factor means
- Factor variances
Moderators
- Continuous covariates
- Categorical covariates
- Examples: age, gender, SES
MNLFA therefore models measurement noninvariance directly, rather than evaluating it only through sequential group-based tests (Kolbe, Jorgensen, and Molenaar 2021; Curran et al. 2014).
Advantages and Limitations of MNLFA
Advantages
- Handles both categorical and continuous moderators
- Avoids arbitrary group discretization
- Provides fine-grained modeling of parameter variation
- Is suited for nonlinear relationships
Limitations
- High model complexity
- Strong distributional and functional-form assumptions
- Requires large sample sizes
- Requires careful model specification
MNLFA is most appropriate when theory suggests systematic moderation of measurement parameters.
SEM Trees
Structural Equation Model (SEM) Trees combine confirmatory structural equation modeling with recursive partitioning to detect parameter heterogeneity across subgroups (Brandmaier et al. 2013, 2016; Arnold, Voelkle, and Brandmaier 2021).
SEM Trees identify subgroups in which model parameters differ by recursively splitting the sample based on covariates.
Core mechanism
- Score-based tests for parameter instability
- Recursive binary partitioning
- Tree-structured subgroup identification
What is detected
- Heterogeneity in measurement parameters
- Heterogeneity in structural parameters
- Data-driven detection of noninvariance
SEM Trees are particularly useful when relevant grouping variables are unknown, continuous, or high-dimensional.
Advantages and Limitations of SEM Trees
Advantages
- Flexible, exploratory detection of noninvariance
- Can capture complex interaction structures
- Transparent and interpretable subgroup definitions
- Does not require pre-specified grouping variables
Limitations
- Risk of overfitting without pruning or cross-validation
- Results depend on splitting criteria and stopping rules
- Less suitable for strictly confirmatory hypothesis testing
- Functional form of moderation is not explicitly parameterized
SEM Trees trade parametric efficiency for flexibility and are most informative in exploratory or misspecified settings.
From Methods to Comparison
MNLFA and SEM Trees represent fundamentally different approaches to detecting measurement noninvariance.
MNLFA
- Parametric
- Requires specification of functional form
- Efficient under correct model specification
SEM Trees
- Nonparametric
- No functional-form assumptions
- Flexible under misspecification
The relative performance of both approaches depends on the alignment between the data-generating process and the assumptions of the analysis model.
Simulation Framework
A Monte Carlo simulation is conducted to compare MNLFA and SEM Trees under varying forms of measurement noninvariance.
Design features
- Parametric data generation
- Multiple population models
- Single-factor and two-factor CFA structures
Indicator structure
- Single-factor model: four manifest indicators
- Two-factor model: one factor with four indicators, one factor with three indicators
Single-factor model
\[ \begin{aligned} \mathbf{x} &= \boldsymbol{\nu}(Z) + \boldsymbol{\Lambda}_x(Z)\,\eta + \boldsymbol{\varepsilon}, \\ \boldsymbol{\varepsilon} &\sim \mathcal{N}(\mathbf{0}, \boldsymbol{\Theta}_\varepsilon) \end{aligned} \]
Two-factor model
\[ \mathbf{x} = \boldsymbol{\nu}_x(Z) + \boldsymbol{\Lambda}_x(Z)\,\eta_1 + \boldsymbol{\varepsilon}(Z) \]
\[ \mathbf{y} = \boldsymbol{\nu}_y(Z) + \boldsymbol{\Lambda}_y(Z)\,\eta_2 + \boldsymbol{\delta}(Z) \]
Simulation: Moderator Functions
Let \(M \sim \mathcal{U}(-1,1)\) denote a bounded continuous covariate.
Moderation is introduced via transformations of \(M\):
Linear
\[ h_1(M) = M \]
Quadratic
\[ h_2(M) = 2M^2 - 1 \]
Sigmoid
\[ h_3(M) = a + \frac{b-a}{1 + \exp\!\bigl(-k(M-c)\bigr)} \]
Noise
No systematic relationship with model parameters.
Each transformed variable enters the model as a separate moderator, allowing controlled variation in the functional form of parameter moderation.
Simulation
Analytical Model Study 1
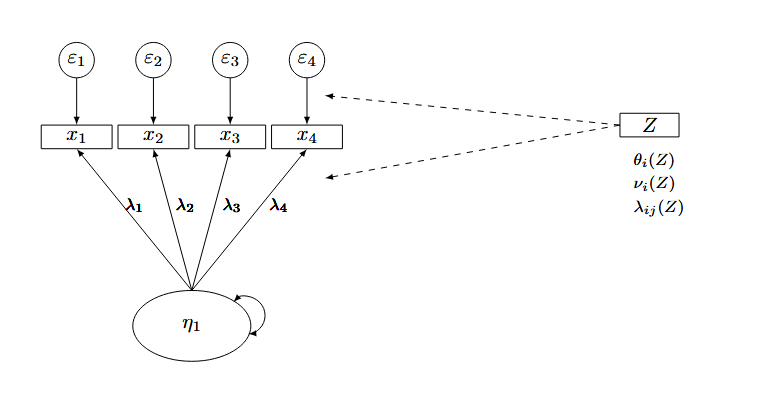
Highlighted components indicate parameters subject to moderation. Analysis is conducted sequentially.
Study 1: Design Factors
Study 1 examines the impact of functional-form misspecification under controlled data-generating conditions without structural misspecification.
Data-generating process
- Moderator form: linear, sigmoid, quadratic, or noise
- Population models: 8 distinct model conditions
- Loading moderation: \(\Delta_\lambda \in \{-0.3, -0.2, 0.2, 0.3\}\)
- Intercept moderation: \(\Delta_\nu \in \{-1, -0.5, 0.5, 1\}\)
- Indicator reliability: \(.60, .70, .80, .95\)
Analysis and sampling
- MNLFA: linear moderation
- SEMTREE: recursive partitioning
- Sample size: \(N \in \{300, 500, 700, 1000\}\)
Functional-form misspecification arises when nonlinear data-generating mechanisms are analyzed under linear moderation assumptions in MNLFA, while SEM Trees impose no parametric form.
Trial Run: Data-Generating Model
The pilot isolates a simple single-factor setting in order to assess initial type I error and power patterns before scaling the full simulation design.
Measurement model
Single-factor CFA with one latent factor \(\eta\) and four indicators \(y_1\)–\(y_4\)
Moderation structure
- \(M_1\): primary moderator
- \(M_2\): secondary moderator
- \(M_0\): noise covariate
Functional forms
- Linear: \(h(M)=M\)
- Quadratic: \(h(M)=2M^2-1\)
- Noise: null condition
Baseline parameters
- Factor loadings: \(\lambda = 0.70\)
- Indicator reliability: \(0.60,\;0.95\)
Population conditions
- Null condition
- Noninvariance condition:
- moderated loadings: \(x_1, x_2\)
- moderated intercepts: \(x_1, x_2\)
- moderated loadings: \(x_1, x_2\)
Trial-run settings
- \(\Delta_\lambda \in \{-0.3, 0.3\}\)
- \(\Delta_\nu \in \{-1, 1\}\)
- Sample size: \(N \in \{300,\;1000\}\)
- Replications: pilot run (e.g., 5–15 seeds per condition)
Trial Run: Analytical Models
SEM Trees (nonparametric)
Model - Single-factor CFA (RAM specification)
Predictors
- \(m_1\), \(m_2\), \(m_0\)
Estimation procedure
- Score-based recursive partitioning
- Bonferroni-corrected split tests
- Pre-pruning:
- \(\alpha = .05\)
- max depth = 3
- minimum node size = 50
Evaluation
- Global tree test
- Root split detection
- Type I error (splits under null)
- Power (splits under true moderation)
MNLFA (parametric)
Model - Moderation via definition variables (OpenMx) - Loadings: \(\Lambda(Z)\)
- Intercepts: \(\nu(Z)\)
Estimation procedure
- Sequential invariance testing:
- Configural model
- Metric model
- Scalar model
Evaluation
- Likelihood-ratio tests (LRT)
- \(\Delta\)CFI, \(\Delta\)RMSEA
Key assumption
- Moderation is linear in the analysis model
Preliminary Results
Overall Results
| Level | Method | Type | Value |
|---|---|---|---|
| Metric | MNLFA | Power | 0.619 |
| Metric | MNLFA | Type I | 0.138 |
| Metric | SEMTREE | Power | 0.611 |
| Metric | SEMTREE | Type I | 0.075 |
| Scalar | MNLFA | Power | 0.459 |
| Scalar | MNLFA | Type I | 0.150 |
| Scalar | SEMTREE | Power | 0.683 |
| Scalar | SEMTREE | Type I | 0.050 |
MNLFA shows elevated Type I error, whereas SEM Trees provide better error control and stronger scalar-level power under these pilot conditions.
Preliminary Results
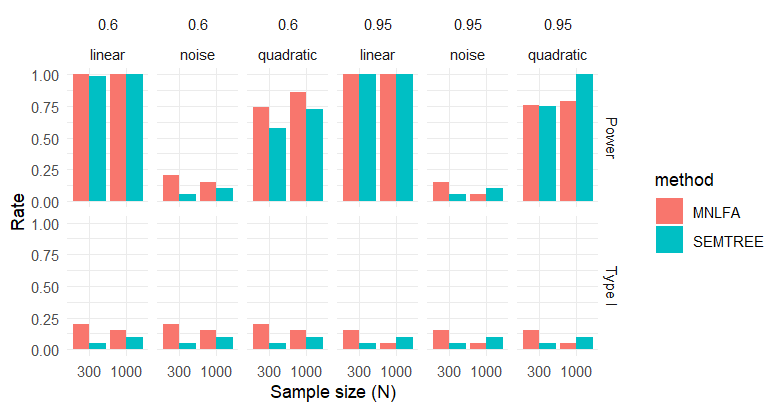 Metric Level MI Testing
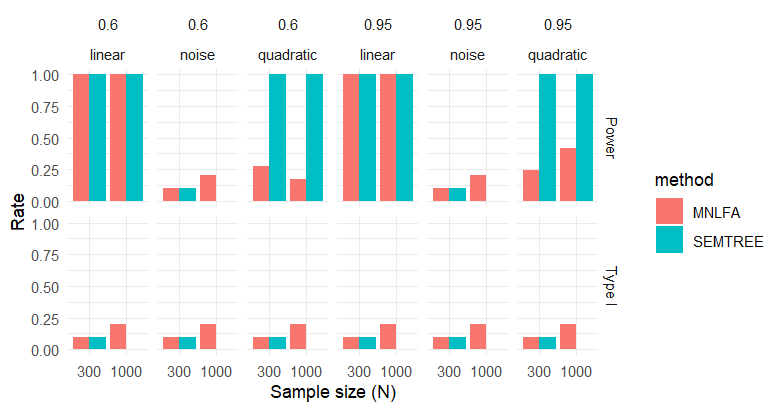 Scalar Level MI Testing
At the metric stage, MNLFA Type I error decreases, reaching 0.050 only when both sample size and reliability are high, whereas SEM Trees remain comparatively stable. At the scalar stage, SEM Trees retain high power under quadratic moderation, while MNLFA power drops markedly.
Questions & Concerns
- How do I ensure that the comparison is fair, the best?
- What Prepruning to use for enhancing power of the trees?
- When do tree splits count as correct?
- What alternative can i use other than significance testing for model fit evaluation?
- Did I forget something in the simulation set-up?
Preliminary Results
Type I Error and Power Metric Stage
| N | Reliability | Moderator | MNLFA Type I | MNLFA Power | SEMTREE Type I | SEMTREE Power |
|---|---|---|---|---|---|---|
| 300 | 0.60 | linear | 0.200 | 1.000 | 0.050 | 0.988 |
| 300 | 0.60 | noise | 0.200 | 0.200 | 0.050 | 0.050 |
| 300 | 0.60 | quadratic | 0.200 | 0.740 | 0.050 | 0.575 |
| 300 | 0.95 | linear | 0.150 | 1.000 | 0.050 | 1.000 |
| 300 | 0.95 | noise | 0.150 | 0.150 | 0.050 | 0.050 |
| 300 | 0.95 | quadratic | 0.150 | 0.755 | 0.050 | 0.750 |
| 1000 | 0.60 | linear | 0.150 | 1.000 | 0.100 | 1.000 |
| 1000 | 0.60 | noise | 0.150 | 0.150 | 0.100 | 0.100 |
| 1000 | 0.60 | quadratic | 0.150 | 0.862 | 0.100 | 0.725 |
| 1000 | 0.95 | linear | 0.050 | 1.000 | 0.100 | 1.000 |
| 1000 | 0.95 | noise | 0.050 | 0.050 | 0.100 | 0.100 |
| 1000 | 0.95 | quadratic | 0.050 | 0.792 | 0.100 | 1.000 |
Preliminary Results
Type I Error and Power Scalar Stage
| N | Reliability | Moderator | MNLFA Type I | MNLFA Power | SEMTREE Type I | SEMTREE Power |
|---|---|---|---|---|---|---|
| 300 | 0.60 | linear | 0.100 | 1.000 | 0.100 | 1.000 |
| 300 | 0.60 | noise | 0.100 | 0.100 | 0.100 | 0.100 |
| 300 | 0.60 | quadratic | 0.100 | 0.273 | 0.100 | 1.000 |
| 300 | 0.95 | linear | 0.100 | 1.000 | 0.100 | 1.000 |
| 300 | 0.95 | noise | 0.100 | 0.100 | 0.100 | 0.100 |
| 300 | 0.95 | quadratic | 0.100 | 0.245 | 0.100 | 1.000 |
| 1000 | 0.60 | linear | 0.200 | 1.000 | 0.000 | 1.000 |
| 1000 | 0.60 | noise | 0.200 | 0.200 | 0.000 | 0.000 |
| 1000 | 0.60 | quadratic | 0.200 | 0.175 | 0.000 | 1.000 |
| 1000 | 0.95 | linear | 0.200 | 1.000 | 0.000 | 1.000 |
| 1000 | 0.95 | noise | 0.200 | 0.200 | 0.000 | 0.000 |
| 1000 | 0.95 | quadratic | 0.200 | 0.417 | 0.000 | 1.000 |
Preliminary Interpretation
MNLFA
- High power for detecting metric noninvariance
- Elevated Type I error at both levels
- Reduced power at the scalar level
- Sensitive to functional-form misspecification
- Linear analysis vs. nonlinear data-generating processes
- Linear analysis vs. nonlinear data-generating processes
- Sequential testing may propagate misspecification
SEM Trees
- More stable Type I error control across conditions
- Competitive power, particularly for scalar noninvariance
- Performance depends on:
- Sample size
- Reliability
- Pruning / stopping rules
- Sample size
- May be conservative in low-signal settings
MNLFA is efficient under correct specification but sensitive to misspecification, whereas SEM Trees provide more robust error control at the cost of potential conservatism.